Making pretty diagrams with GraphViz
So recently I needed to draw some directed-graph diagrams - work-flow diagrams in this particular instance. After a bit of googling I came across some nice examples of diagrams produced by graphviz - actually what really turned me on to graphviz was this nice set of examples from Kent Bye.
A little tinkering and I soon had my workflow definitions (declared in xml in our application) rendered nicely with GraphViz. The markup language is deadly simple and intuitive, and the directed graphs which it produces are really good looking (I didn't try any other types).
Lets take a look at some examples, starting simply with two nodes related in one direction only. The markup would look like this:
digraph {
  "Start" -> "End" [];
}
That's it. No really. This is all you need to create a simple, two-node directed graph diagram. To draw the diagram you need to install graphviz (with a quality OS like ubuntu you just need the magic incantation sudo apt-get install graphviz and you're up and running). Once installed invoke graphviz like this:
dot -Tpng -oMyGraph.png MyGraph.dot
This invokes the directed-graph drawing tool, tells it to produce a png image from the input file MyGraph.dot and store it in the output file MyGraph.png. The resulting diagram looks like this:
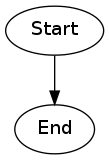
Coolness!
Lets get a bit more trick! We can control the size and shape of our nodes, and label the edges:
digraph {
  "A" [shape="circle"];
  "B" [shape="rectangle"];
  "C" [shape="diamond"];

  "A" -> "B" [label="A to B"];
  "B" -> "C" [label="B to C"];
  "A" -> "B" [label="A to C"];
}
Here's the diagram:
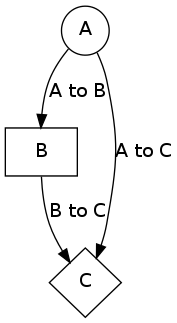
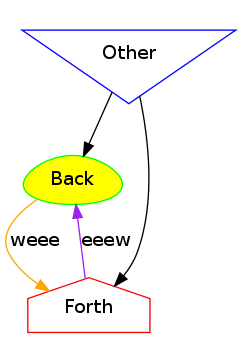
Isn't it just too cool? Last one coming up - this time with colours:
digraph {
  "Back" [shape="egg" color="green" style="filled" fillcolor="yellow"];
  "Forth" [shape="house" color="red"];
  "Other" [shape="invtriangle" color="blue"];

  "Back" -> "Forth" [color="orange" label="weee"];
  "Forth" -> "Back" [color="purple" label="eeew"];

  "Other" -> "Forth"
  "Other" -> "Back"
}
And here's how it looks:
I realize this just scratches the surface - there's a whole bunch of other node shapes you can use, you can define defaults for nodes and edges once at the beginning of your *.dot file, and much much more.
I only discovered GraphViz about 2 months ago, but since I did i've been using it quite a lot. Its very handy for drawing simple representations of work-flows, navigational flows, any kind of hierarchical structures (trees and graphs), etc., and just so simple to write. Generating the *.dot syntax programmatically is extremely easy - I now have our app invoking "dot" to generate the graphs on the fly.
Note: Google Charts now has experimental support for (a subset of) graphviz. Check it out here.You don't even have to install graphviz :)
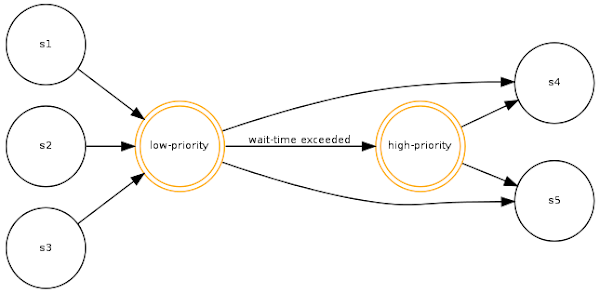
I'll leave you with one more example - a visualisation of a subset of a work-flow from a work-flow system I've been building recently for our Editorial System. The work-flow engine we've built is basically a Finite State Machine (FSM), and a work-flow diagram like this is basically a State diagram for the machine. A workflow thus forms a very nice directed graph, making GraphViz ideal for rendering work-flows:
digraph {

  node [shape=circle,fontsize=8,fixedsize=true,width=0.9];
  edge [fontsize=8];
  rankdir=LR;

  "low-priority" [shape="doublecircle" color="orange"];
  "high-priority" [shape="doublecircle" color="orange"];

  "s1" -> "low-priority";
  "s2" -> "low-priority";
  "s3" -> "low-priority";

  "low-priority" -> "s4";
  "low-priority" -> "s5";
  "low-priority" -> "high-priority" [label="wait-time exceeded"];

  "high-priority" -> "s4";
  "high-priority" -> "s5";

}
And here's the GraphViz output: